
Mastering Your Audience: How to Analyze Traffic Sources in GA4 for Your Website
Understanding where your users come from is the single most critical task in digital marketing. Without accurate traffic source analysis, optimizing your marketing budget, content strategy, and website conversion paths is impossible.
Google Analytics 4 (GA4) moves beyond the static "Source / Medium" world of Universal Analytics (UA). Its event-driven model offers a far more flexible, granular, and powerful way to understand user journeys.
This guide is your practical roadmap to navigating GA4's Acquisition reports, customizing your data views, and turning raw traffic numbers into actionable growth insights for your website.
GA4's Approach to Traffic Sources: The Core Concepts
GA4's approach is built on flexibility, defined by how metrics and dimensions are measured across the customer lifecycle.
Dimension Scopes: User, Session, and Event
The first concept to master is scope. In GA4, every dimension belongs to one of three scopes, which determines the data shown in reports:
- User-scoped: Attributes that stick with the user across all sessions and interactions. Example: First user default channel group.
- Session-scoped: Attributes related to a single visit or session on your site. This is often the most relevant scope for initial traffic analysis. Example: Session source / medium.
- Event-scoped: Attributes tied only to a specific event action. Example: Page
location
tied only to the
page_viewevent.
For most traffic analysis, you will focus on Session-scoped dimensions (for comparing current marketing effectiveness) and User-scoped dimensions (for understanding initial customer discovery).
Default Channel Group
The Default Channel Group is a simplified, pre-defined dimension that automatically buckets your traffic into high-level categories based on how GA4 interprets the source and medium parameters (including those from your UTM tags).
Common Default Channel Groups include:
UTM Parameters Revisited: The Backbone of Accuracy
GA4 cannot accurately categorize paid social, email, or specific partner campaigns without correct UTM tagging. Your UTMs feed directly into the source and medium dimensions that GA4 uses to populate the Default Channel Group.
Rule: Every non-Google marketing link should include:
utm_source(e.g., tiktok)utm_medium(e.g., cpc or paid_social)utm_campaign(e.g., Q4_Retargeting_Sale)
Navigating the Key GA4 Traffic Acquisition Reports
GA4 provides two primary acquisition reports: one for how users arrived (User Acquisition) and one for how sessions started (Traffic Acquisition).
Overview Report
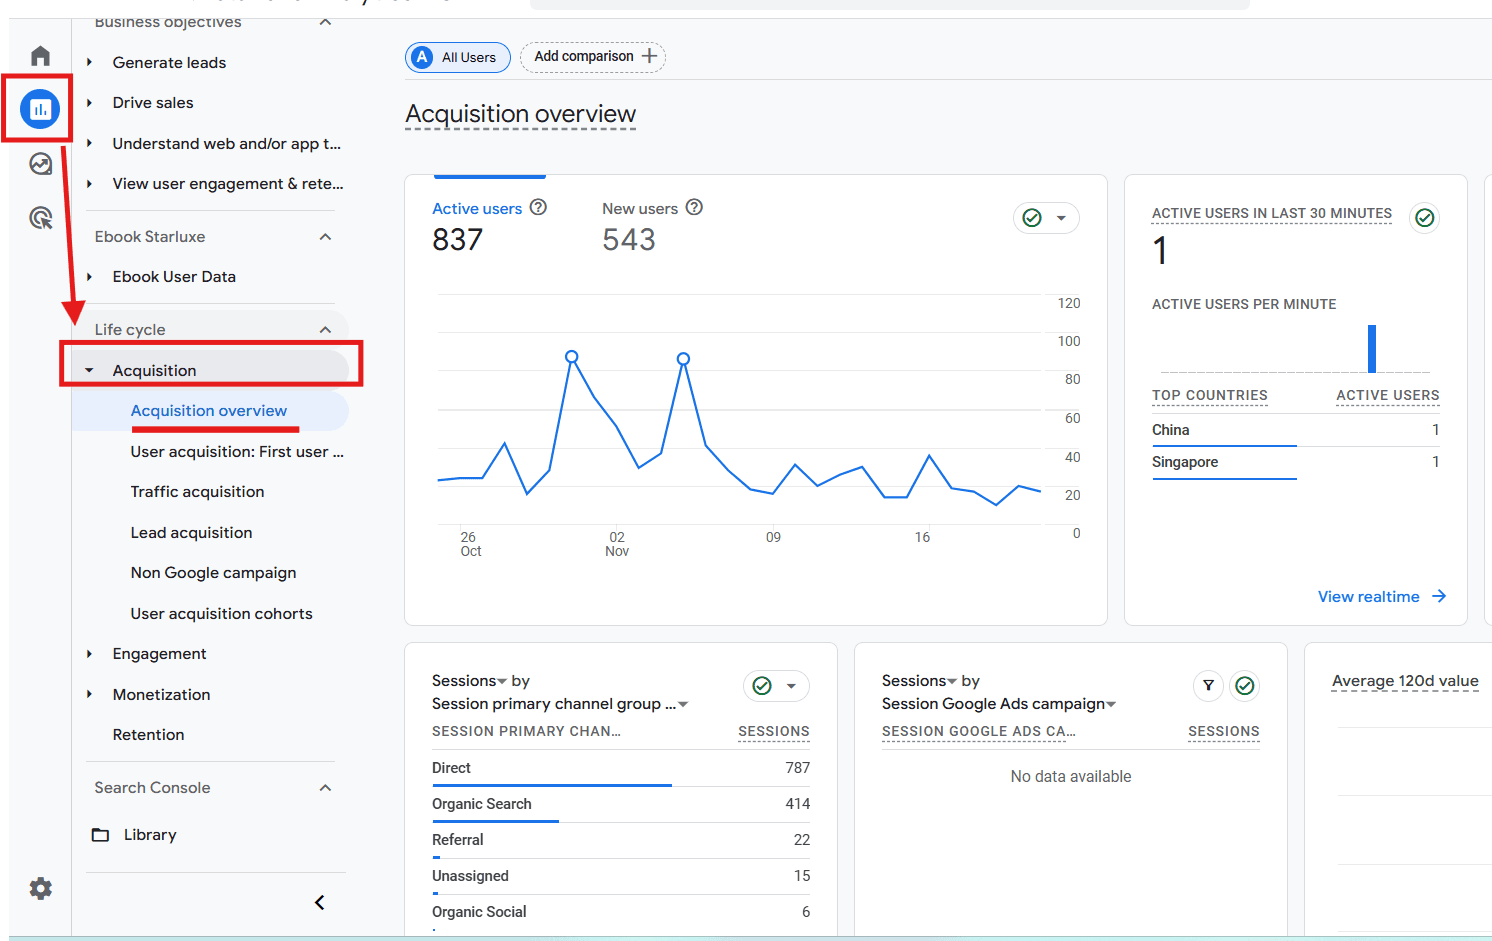
Navigation: Reports > Acquisition > Overview
Purpose: Provides a high-level summary of traffic and engagement performance.
Key Cards: Look at the Users by Session default channel group card for a quick performance snapshot of your current marketing efforts, and the New users by first user default channel group for insight into how new users are discovering your site.
Traffic Acquisition Report (Session-scoped)
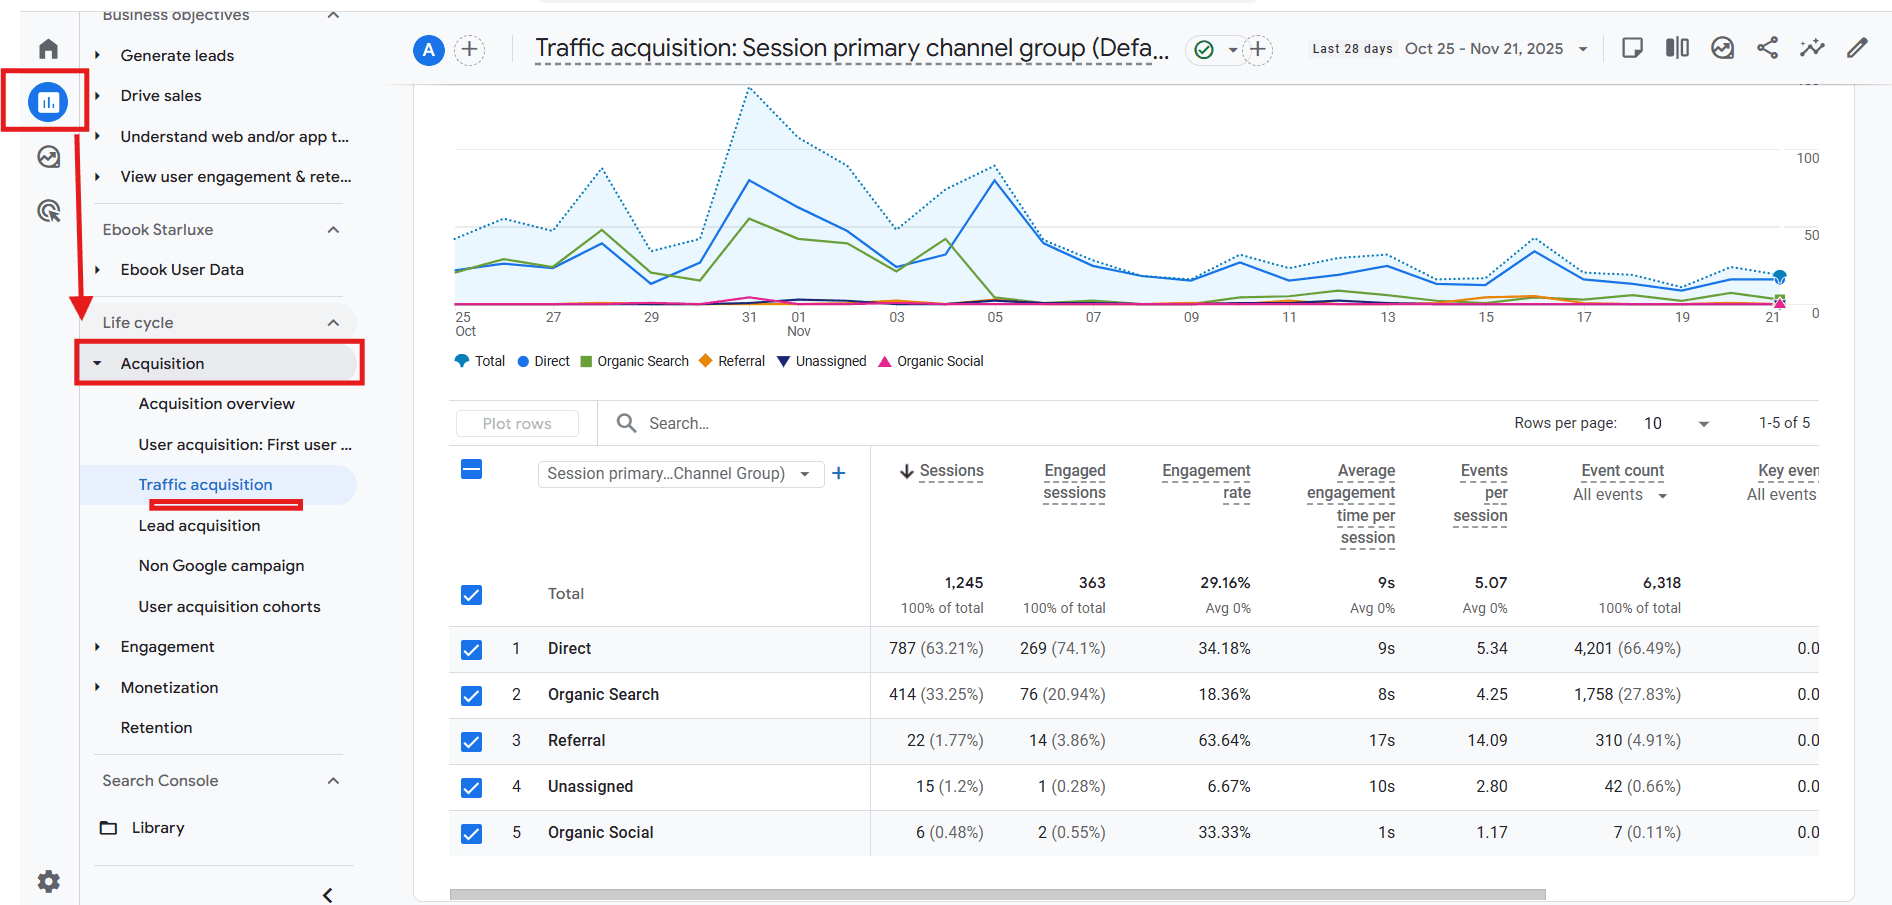
Navigation: Reports > Acquisition > Traffic Acquisition
Purpose: Analyzes the performance of the session—how did the user arrive in this specific visit? This is the most comparable report to the Source/Medium report in UA.
Primary Dimension: By default, this report uses Session default channel group.
1. Customize the Primary Dimension
This is the first action item for deep analysis:
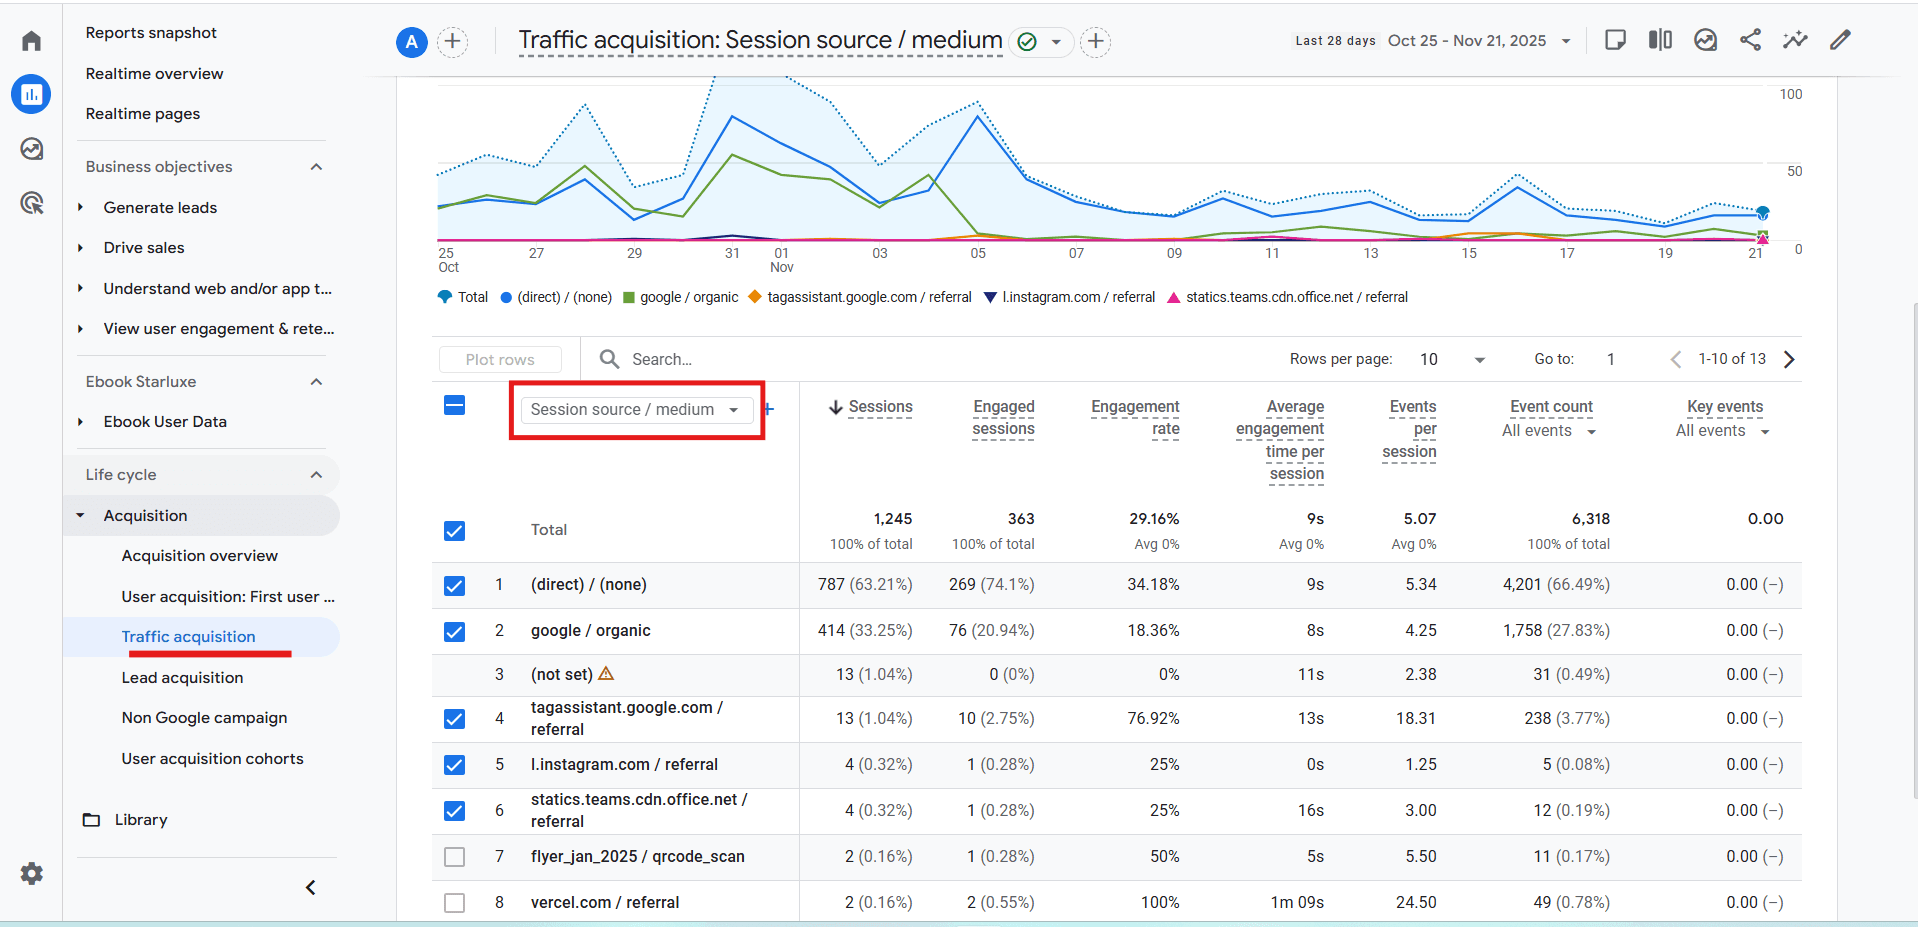
- Click the dropdown menu above the table header (Session default channel group).
- Change the primary dimension to Session source / medium. This provides the raw, granular data needed to debug UTM issues or compare specific platforms (e.g., google / organic vs. bing / organic).
2. Add a Secondary Dimension
To connect source data to specific initiatives:
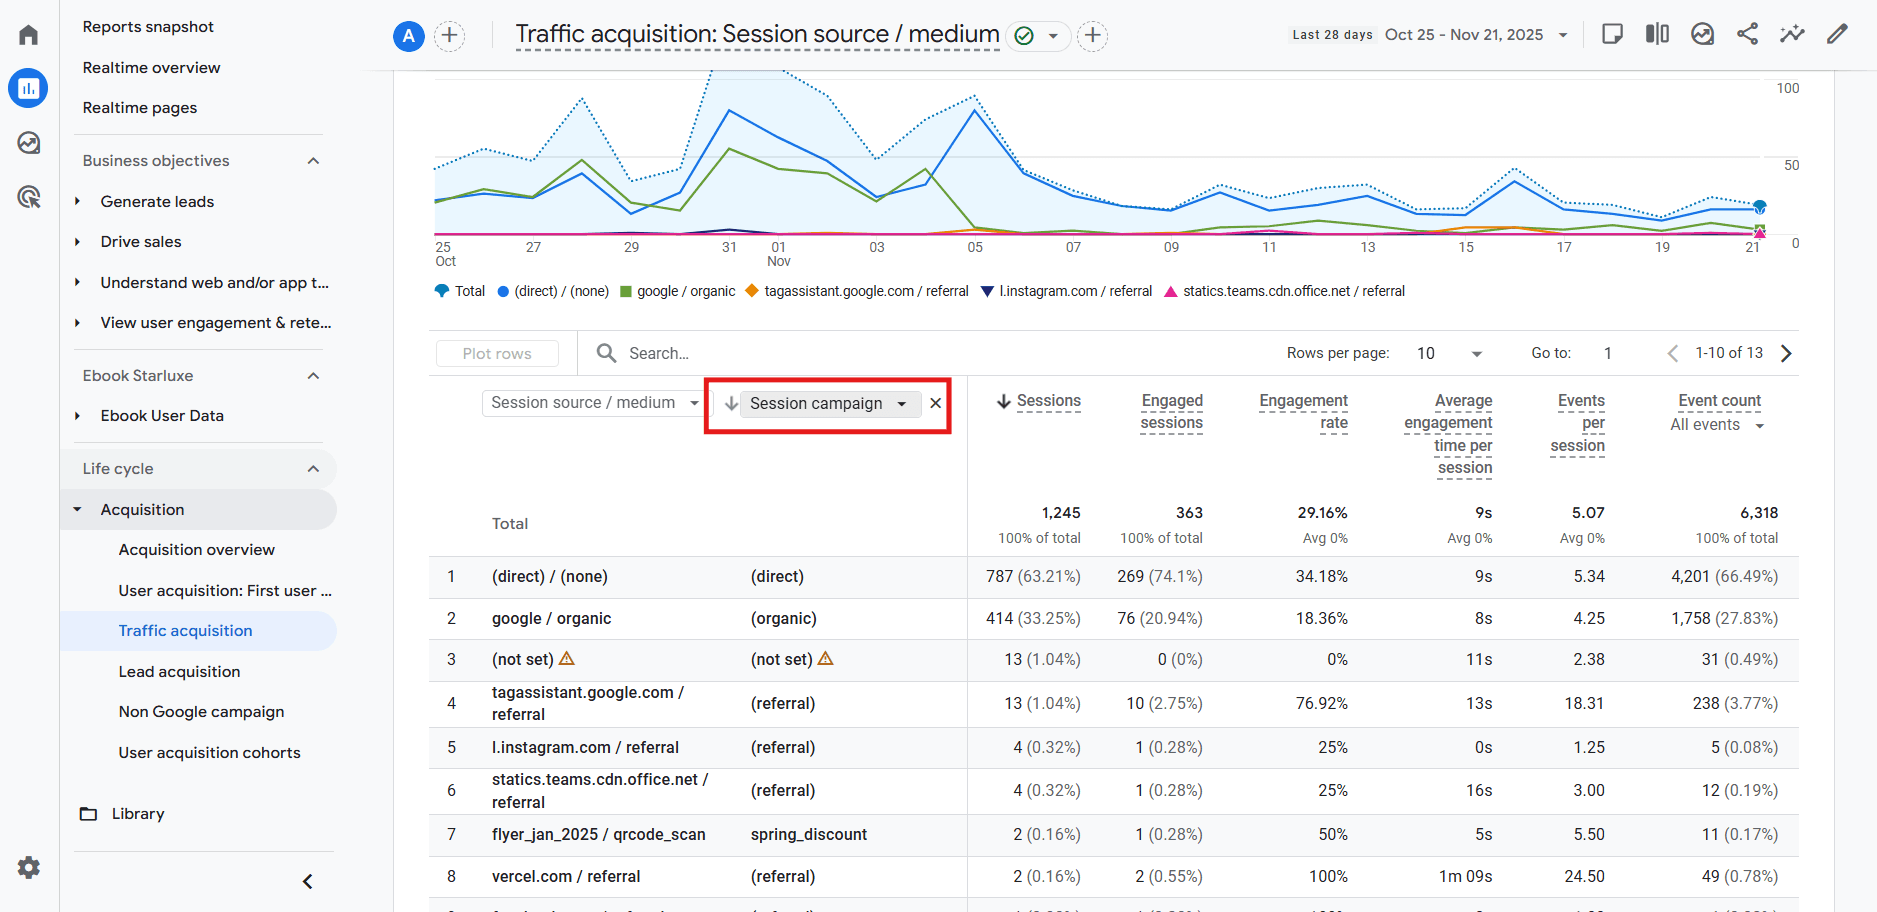
- Click the plus sign (+) next to the primary dimension header.
- Add Session campaign to see performance broken down by your UTM campaigns, or add Landing page to understand which pages channels are driving traffic to.
3. Emphasize Key Metrics
Focus on these metrics to assess channel quality, not just volume:
User Acquisition Report (User-scoped)
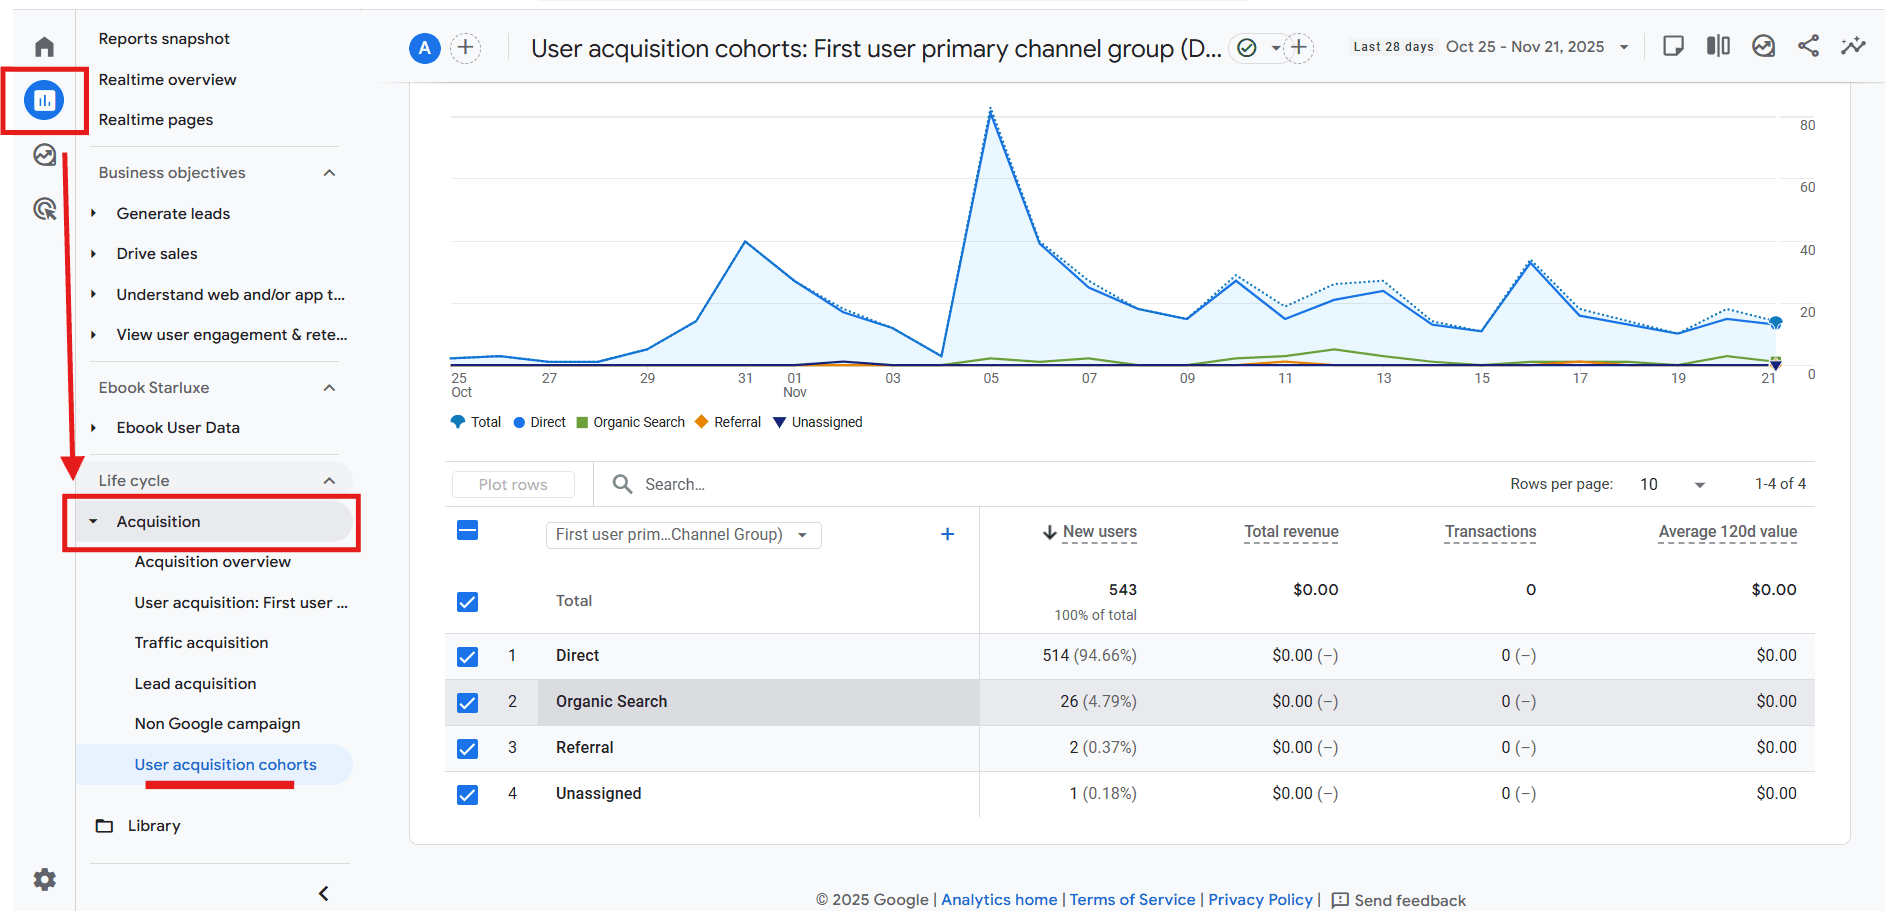
Navigation: Reports > Acquisition > User Acquisition
Purpose: Analyzes the performance of the user—how did the user arrive on their very first visit? This is essential for understanding initial discovery and the ROI of top-of-funnel marketing.
Primary Dimension: By default, this report uses First user default channel group.
Value: If a user first came from a Paid Search ad, but later returns directly, the User Acquisition report still credits Paid Search. This gives a more accurate picture of acquisition impact.
Deep Dive: Customizing for Deeper Insights
Standard reports provide a good overview, but Explorations are where truly advanced analysis happens in GA4. They allow you to build custom tables, funnels, and segments tailored to your business needs.
Custom Reports with Explorations
Explorations allow you to build custom tables and charts from scratch, giving you full control over dimensions, metrics, and filtering logic.
Navigate: Click Explore in the GA4 left-hand navigation.
Create: Select Free-form Exploration.
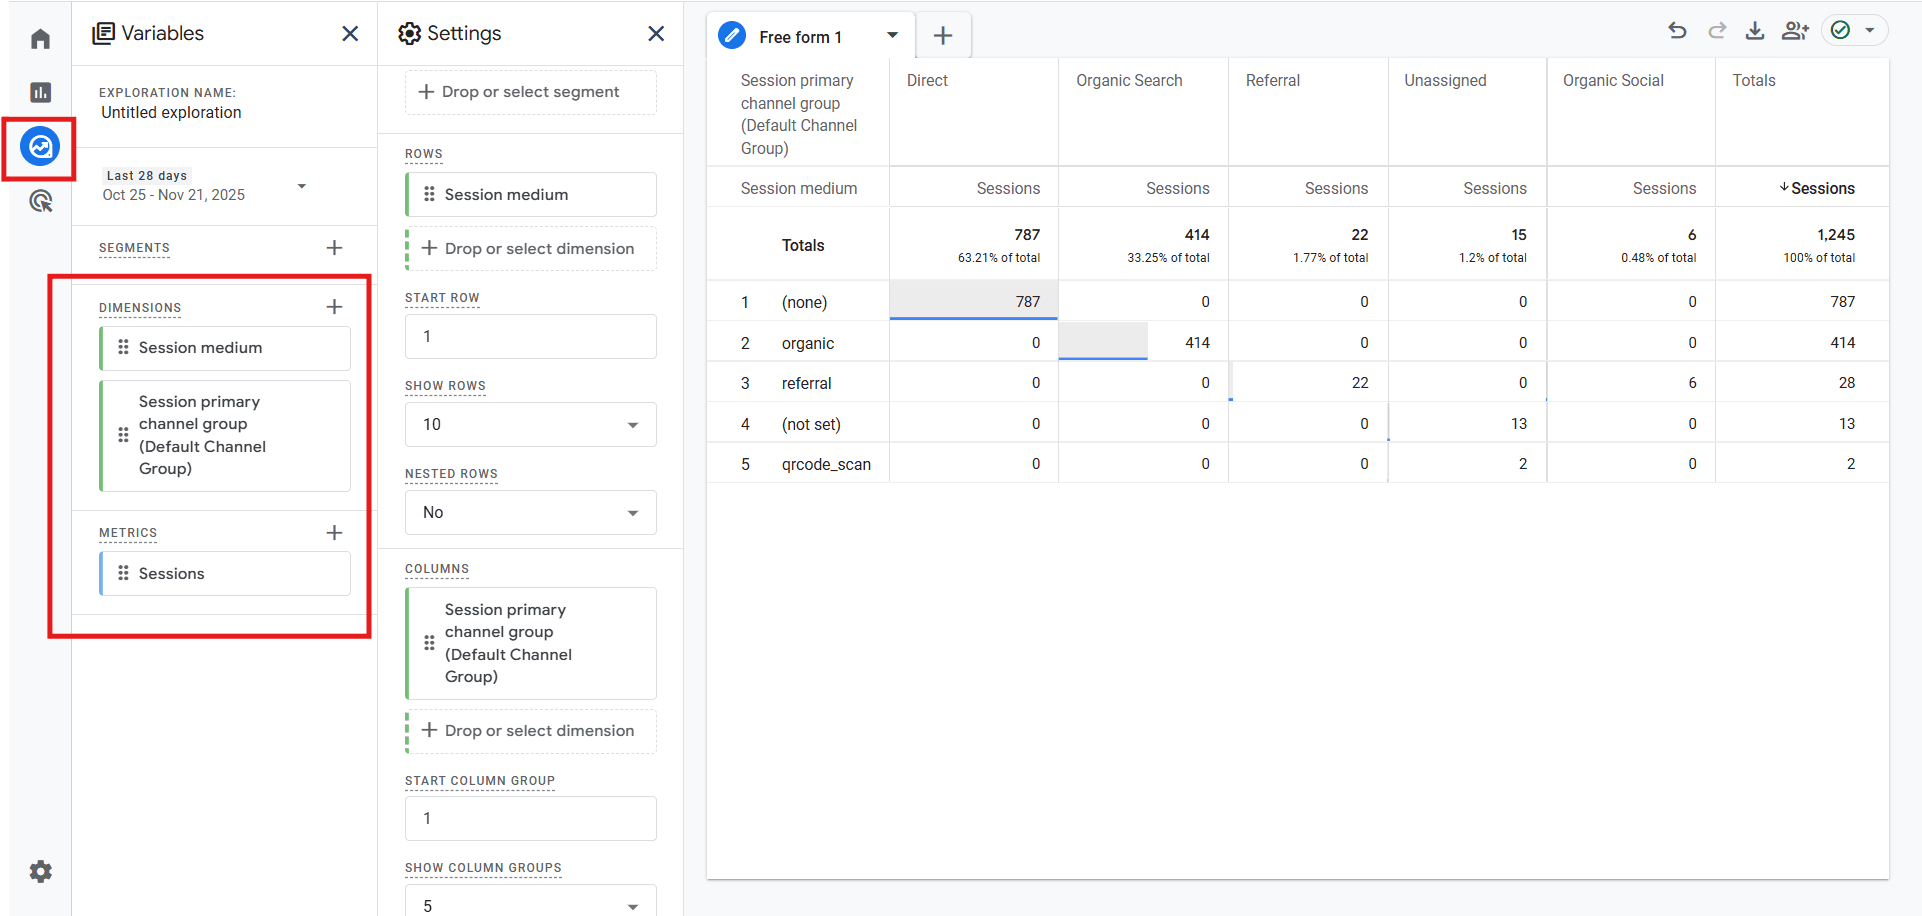
Variables Setup:
- Dimensions (Rows): Import and set Session source / medium or Session default channel group.
- Metrics (Values): Import and set Sessions, Conversions, and Total Revenue.
- Filters: Define your segments here (e.g., filter where Session default channel group = Paid Social).
Drag and Drop:
- Drag your chosen Dimensions into the Rows area.
- Drag your chosen Metrics into the Values area.
Path Exploration for User Journeys
Path Exploration visually maps how users navigate from one page or event to another. This is extremely useful for diagnosing funnel drop-offs and understanding how users behave after landing on your site.
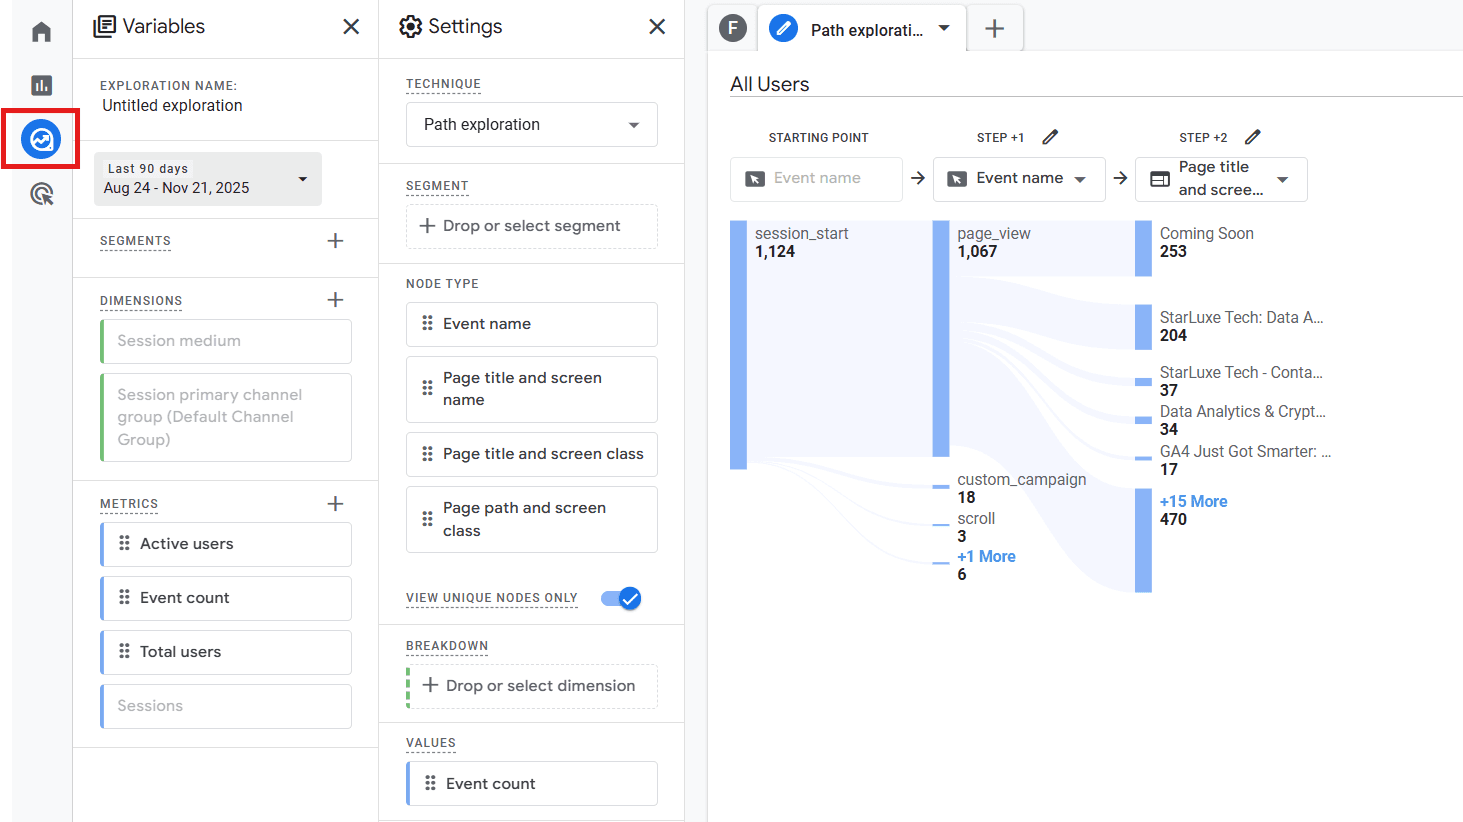
Example: Start a path exploration with Session source = linkedin.com to see how LinkedIn users navigate your funnel and where they exit.
Custom Dimensions & Metrics (Advanced)
If you use non-standard tracking (like an internal campaign ID not covered by UTM parameters), you can create Custom Dimensions.
Example: If each pageview event contains an internal_tracking_id parameter,
register it as a Custom Dimension and use it in Explorations alongside Session source / medium for
deeper segmentation.
Interpreting Your Data: What the Numbers Mean
Knowing where to look is only half the battle. Interpreting the numbers is what drives real action.
1. Identifying Top Performers
A channel is considered a top performer if it ranks high in Conversions and Total Revenue while also showing a strong Engagement Rate.
Action: Allocate more budget to high-performing channels and examine their landing pages to replicate success across weaker channels.
2. Underperforming Channels
High traffic with low engagement or zero conversions indicates underperformance.
Action: Review ad messaging, targeting, and landing page alignment.
3. Audience Behavior Differences
Compare Average Engagement Time and Events per Session across channels to understand user intent.
4. Conversion Paths
Use the Conversion Paths report in the Advertising section to see which channels assist conversions rather than directly close them.
Insight: A channel like Paid Social might rarely be the final click, but could still be the first touchpoint for most customers.
Best Practices for Accurate Traffic Source Analysis
Data quality determines the accuracy of your insights. Follow these best practices to ensure clean attribution:
1. Consistent UTM Tagging (The Golden Rule)
If you manage paid media, emails, or social posts, ensure consistent UTM structures for all campaign links.
2. Exclude Self-Referrals
A “self-referral” occurs when your own domain or payment gateway shows up as the traffic source, breaking session continuity.
Action: Add your domain (and gateways like paypal.com) to the Unwanted Referrals list in your GA4 Data Stream settings.
3. Clean Up Unwanted Referrals
Remove spammy or irrelevant referral traffic to keep your data clean.
4. Data Freshness
GA4 can take 24–48 hours to update certain metrics like conversions and cost imports. Always consider this delay when reviewing recent data.
Conclusion: Empowering Data-Driven Decisions
Mastering GA4 Acquisition reports enables you to understand exactly where users come from, how they behave, and which channels drive the most value. By leveraging scopes, UTMs, Explorations, and attribution reports, you unlock the insights needed to grow your business with confidence.


